Welcome to DiveR User Manual
Note
This project is under active development.
1. About
1.1. Viral Sequence Diversity Dynamics Visualization in R (DiveR)
Viruses are one of the main contributors to the global burden of infectious-related mortality and disability. Sequence diversity, as a result of various evolutionary forces, can expand host repertoire or enhance infective ability of viruses, resulting in immune escape. This poses a challenge to the design of diagnostic, prophylactic, and therapeutic interventions against viruses. Thus, it is crucial to understand the diversity and the dynamics of viral se-quence change to aid in the design of vaccines or development of therapeu-tics and diagnostics against a virus. The publicly available tool, Diversity Motif Analyser (DiMA; https://github.com/PU-SDS/DiMA) was developed to facilitate the dissection of sequence diversity dynamics for viruses. DiMA quantifies the sequence diversity using Shannon’s entropy for each aligned overlapping k-mer positions, distributes the k-mers into four diversity motifs (index, major, minor and unique) and stores this information in JSON format. However, interpretation and analysis of data stored in JSON data might be a challenging task to biologists who have limited or no knowledge of bio-informatics or programming background.
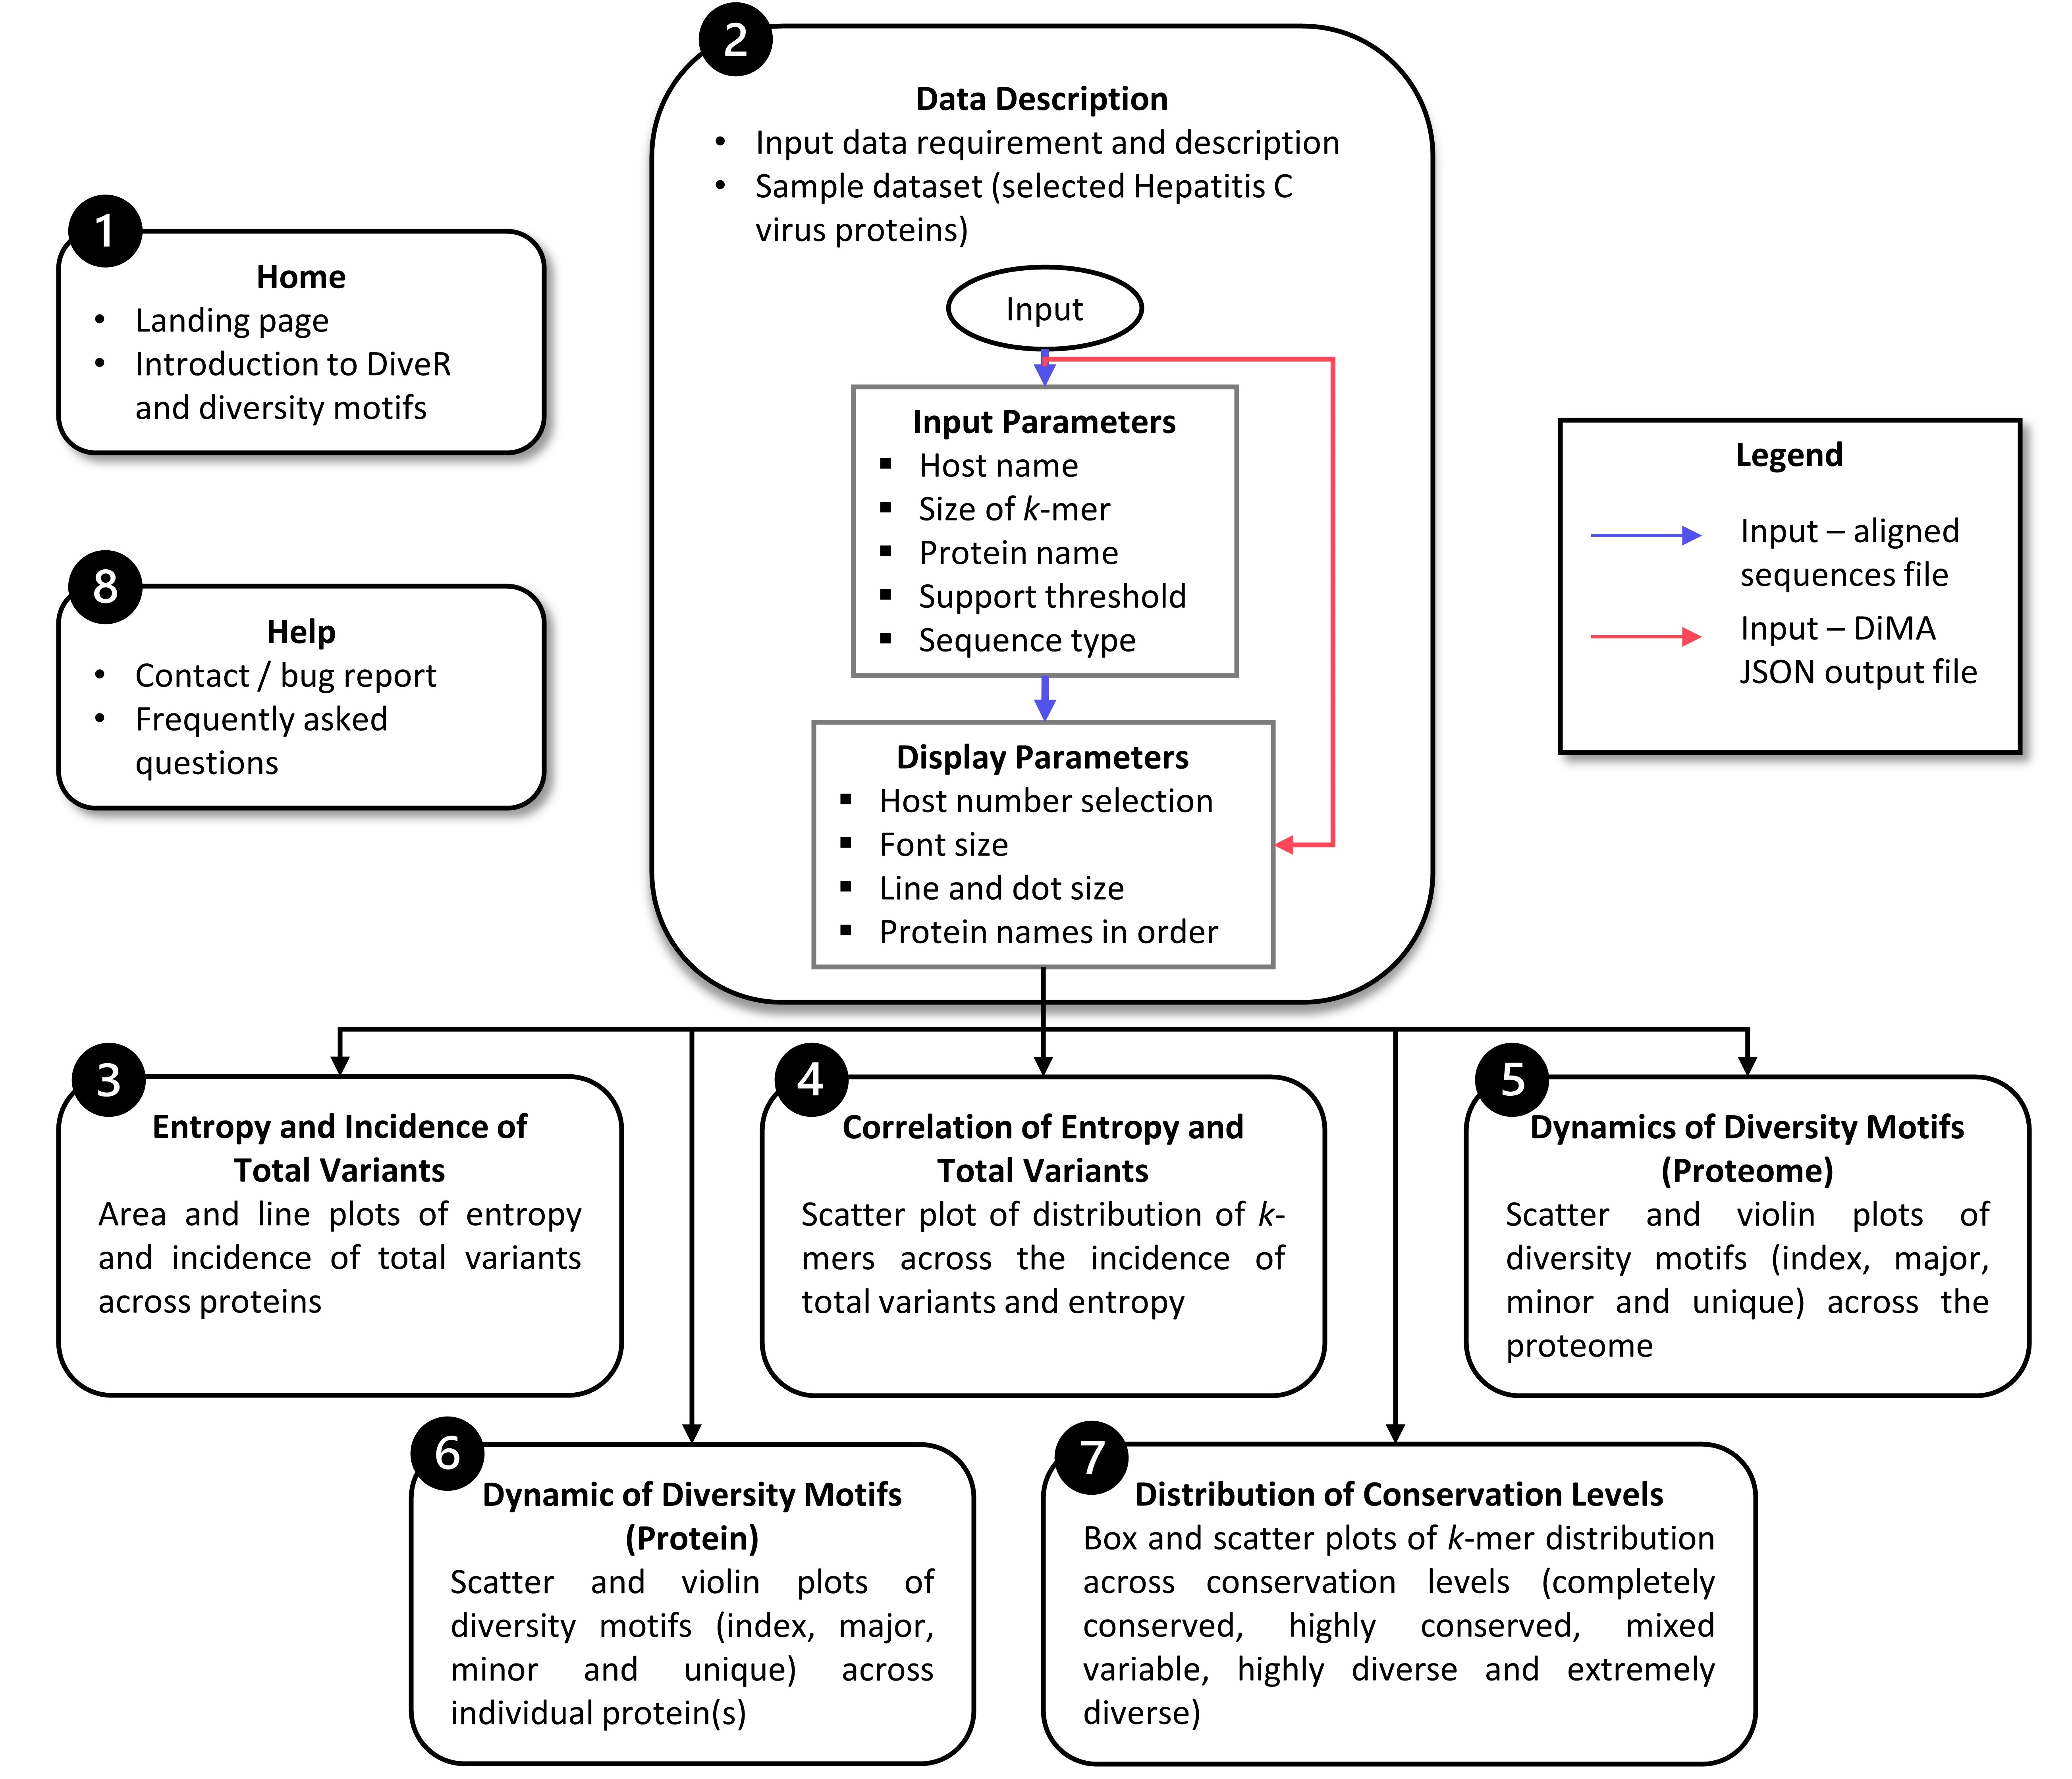
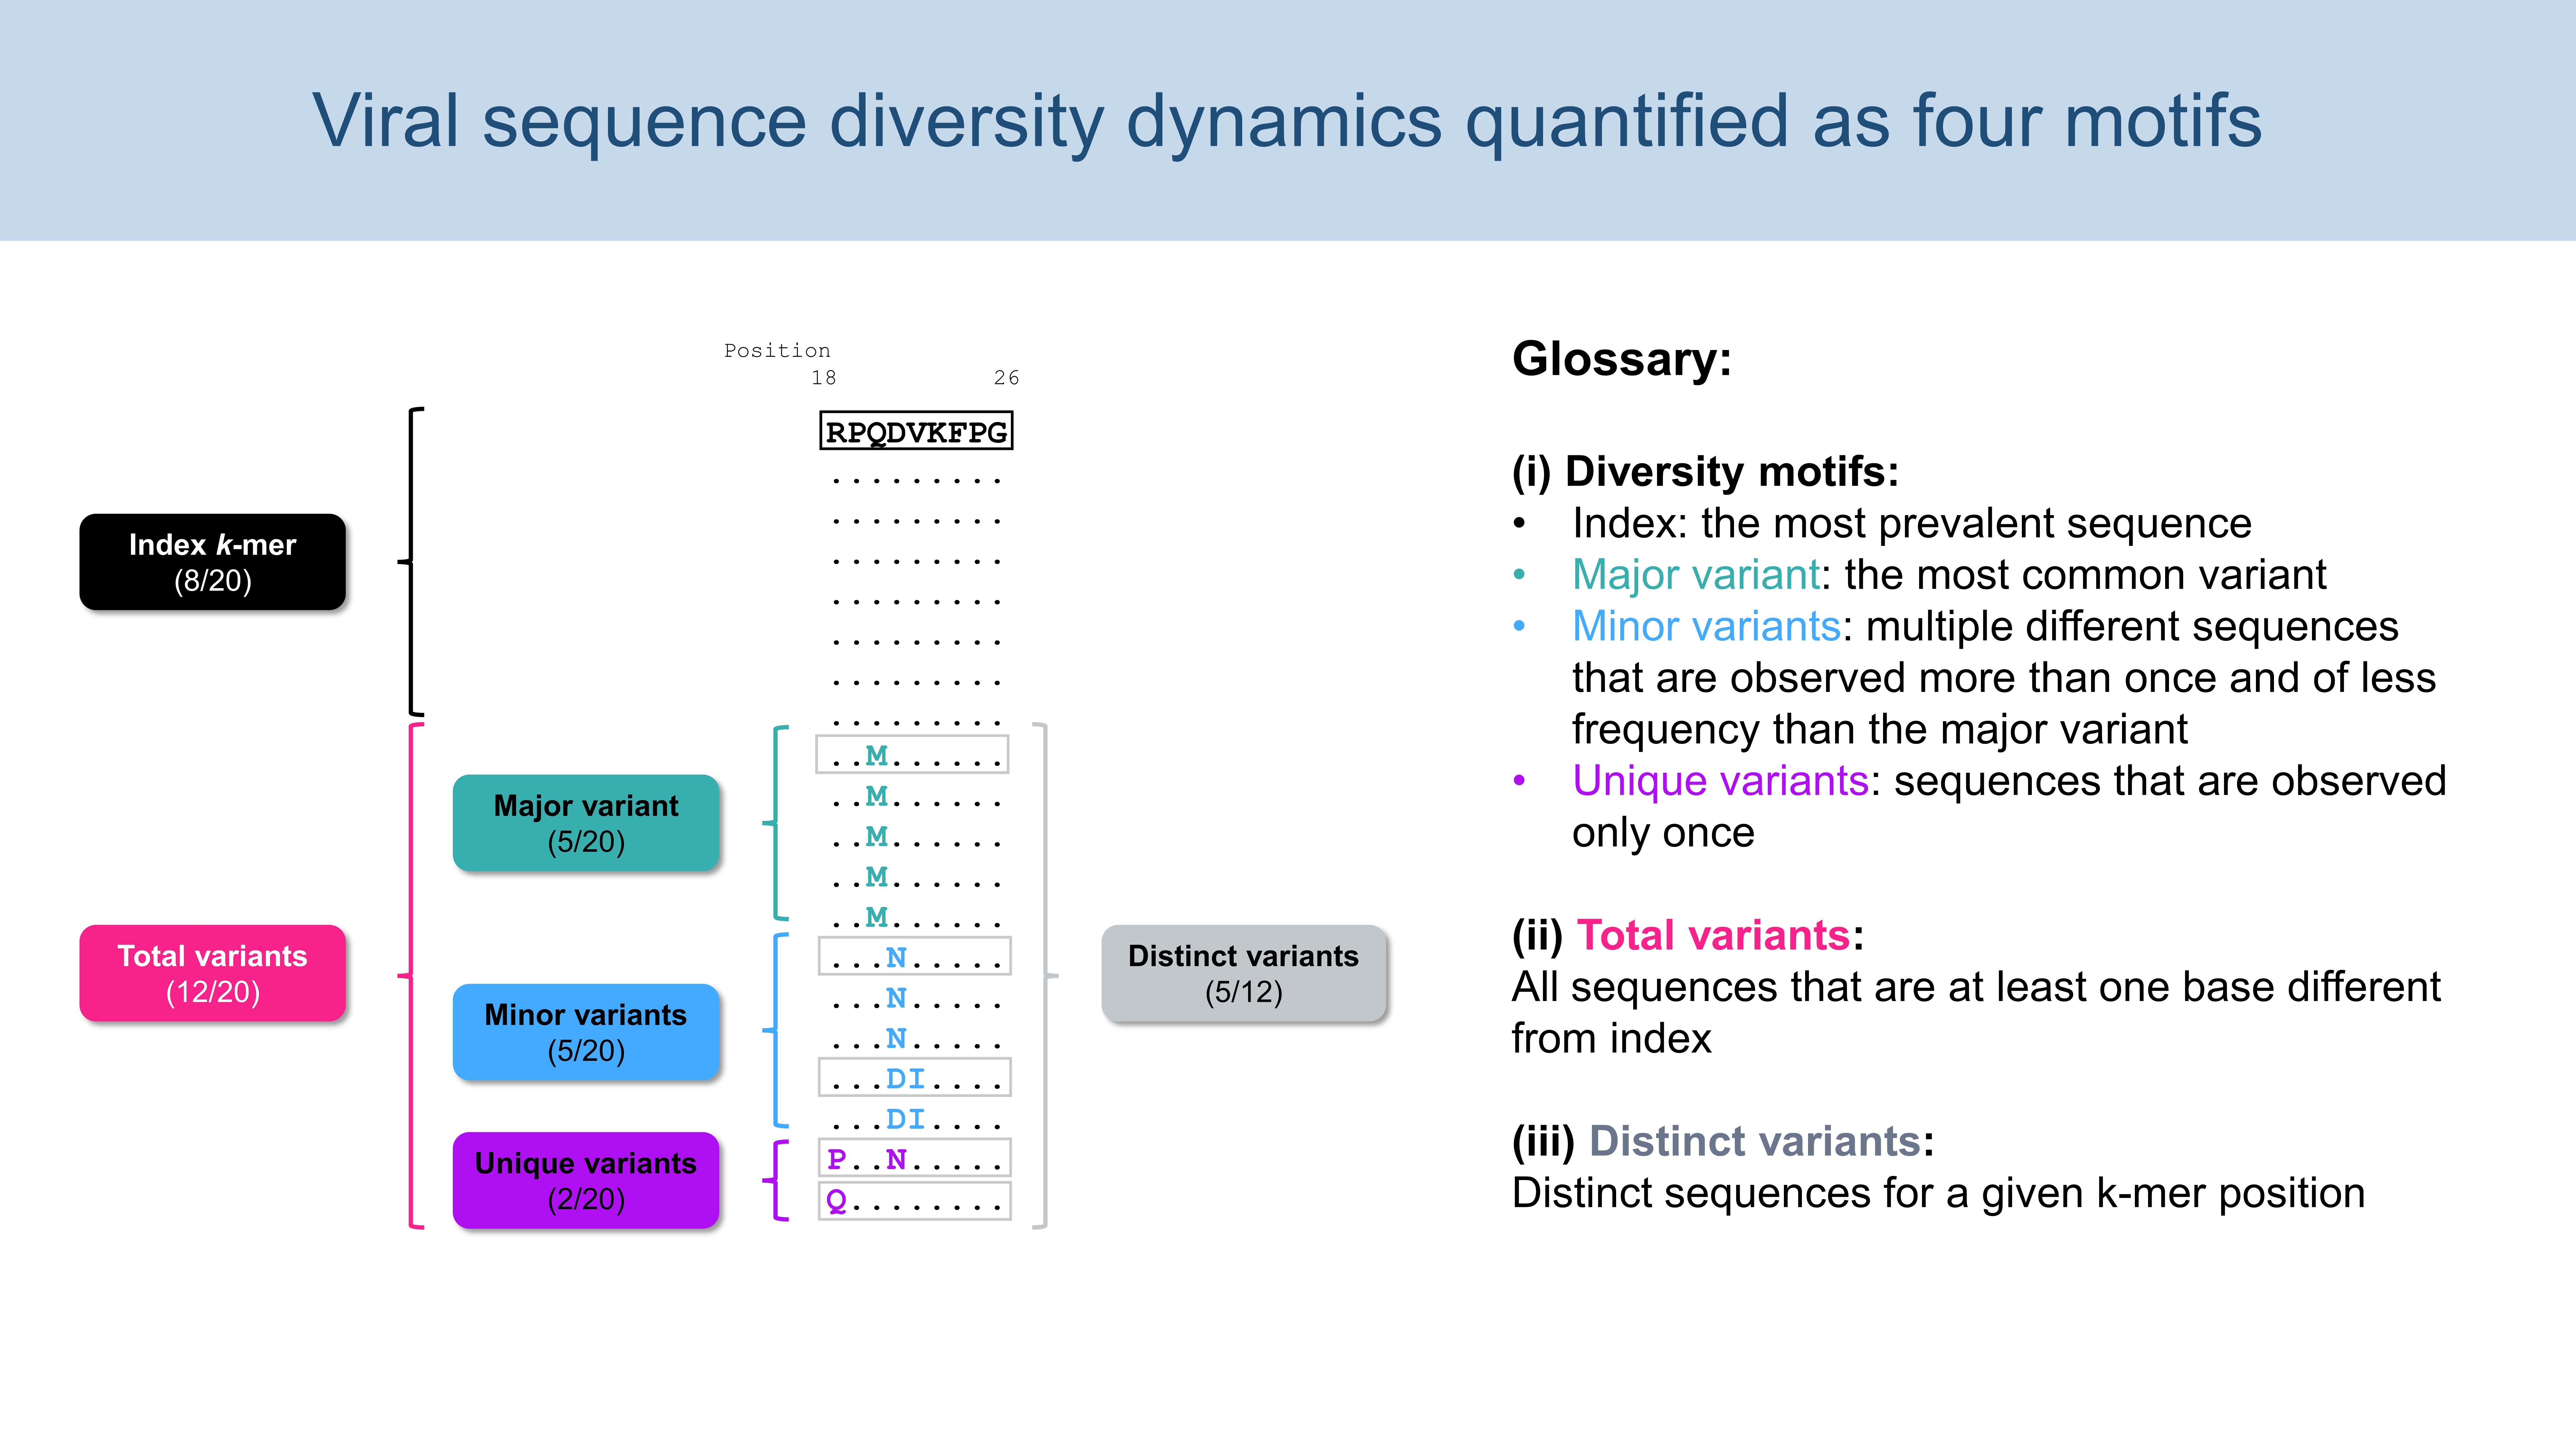
Herein, we present DiveR, a DiMA wrapper implemented as a web-based application, hosted on R Shiny server https://protocol-viral-diversity.shinyapps.io/DiveR, to ease the visualization of outputs from DiMA. DiveR allows visualization of the diversity motifs (index, major, minor and unique) for elucidation of the underlying inherent dynamics. The sequence with the highest incidence at a given k-mer position in a protein alignment is the index, while all the others at the position are variants to the index. Major variant is the predominant sequence amongst the variants, while minor variants are distinct sequences with frequency lesser than the major variant, but occur more than once. Unique variants are distinct sequences that occur only once. DiveR presents a total of eight tabs: 1) homepage, 2) data description, with tabs 3) to 7) presenting five plots depicting sequence variability dynamics and lastly 8) help page tab (Figure 1). DiveR generates five plots for k-mer positions of a viral protein/proteome: (i) entropy and in-cidence of total variants, (ii) relationship between entropy and total variants, (iii) dynamics of diversity motifs for the collective proteome and individual proteins (iv), and (v) distribution of conservation levels (completely conserved, highly conserved, mixed variable, highly diverse, and extremely diverse). In summary, the simplicity of DiveR makes the study of viral protein sequence diversity dynamics more accessible to a wider community of researchers. This should help better understand the dynamics of sequence change among viruses and further explore its effects on intervention strategies. Besides being available as a web server, DiveR can also be downloaded as a standalone R Shiny App (https://github.com/pendy05/DiveR).
1.2. Availability
DiveR is publicly available at https://protocol-viral-diversity.shinyapps.io/DiveR/ and the R source code is released under the MIT License and openly available from the GitHub repository at https://github.com/pendy05/DiveR.
1.3. Diversity Motifs
2. Input file and parameters
2.1. Input file
DiveR requires either aligned sequence file(s) or DiMA output file(s) (JSON format) as input file(s), where DiveR will convert and concatenate them (the inputs) into a single CSV file (Figure 2), which will act as the source for subsequent data visualisation. Each aligned sequence / DiMA output file is treated as one viral protein. Currently, DiveR accepts aligned FASTA or JSON files generated using multiple sequence alignment (MSA) tools and DiMA, respectively.
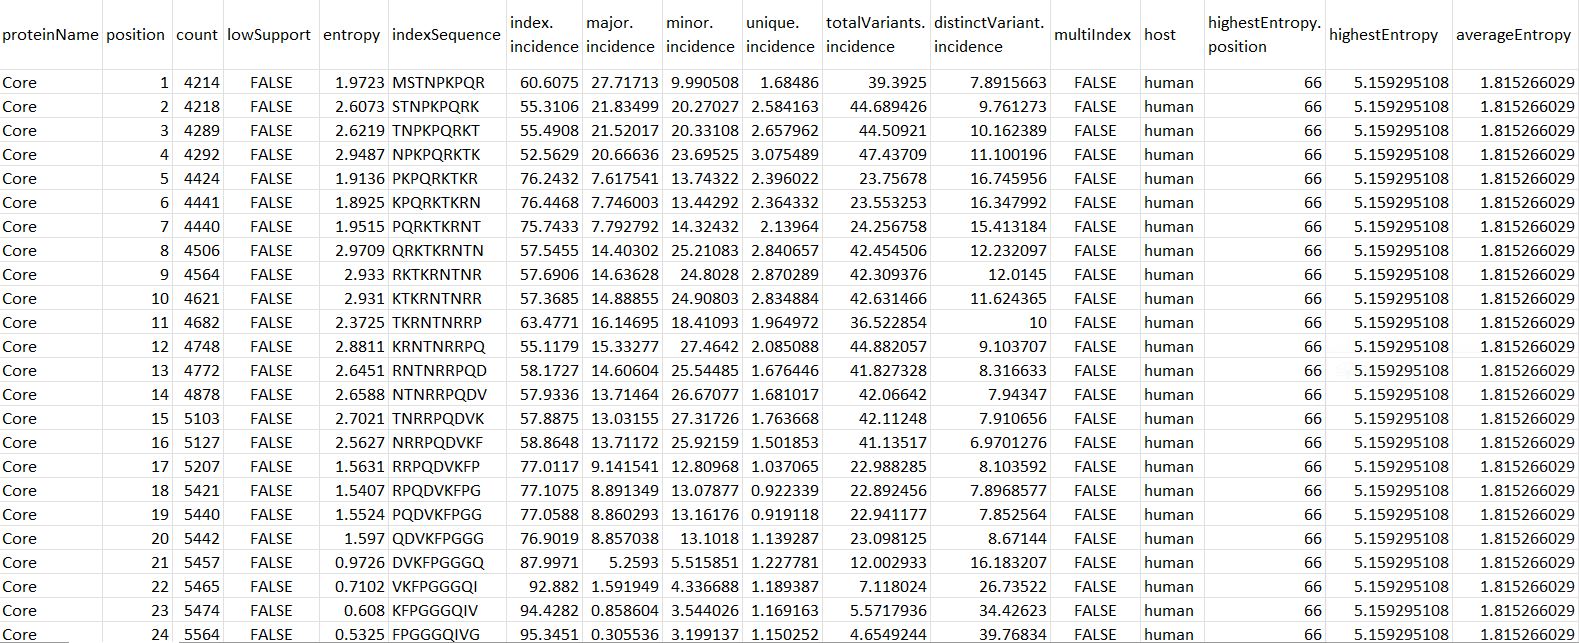
Figure 2. DiMA JSON-Converted CSV Output Format.
proteinName: name of the protein
position: starting position of the aligned, overlapping k-mer window
count: number of k-mer sequences at the given position
lowSupport: k-mer position with sequences lesser than the minimum support threshold (TRUE) are considered of low support, in terms of sample size
entropy: level of variability at the k-mer position, with zero representing completely conserved
indexSequence: the predominant sequence (index motif) at the given k-mer position
index.incidence: the fraction (in percentage) of the index sequences at the k-mer position
major.incidence: the fraction (in percentage) of the major sequence (the predominant variant to the index) at the k-mer position
minor.incidence: the fraction (in percentage) of minor sequences (of frequency lesser than the major variant, but not singletons) at the k-mer position
unique.incidence: the fraction (in percentage) of unique sequences (singletons, observed only once) at the k-mer position
totalVariants.incidence: the fraction (in percentage) of sequences at the k-mer position that are variants to the index (includes: major, minor and unique variants)
distinctVariant.incidence: incidence of the distinct k-mer peptides at the k-mer position
multiIndex: presence of more than one index sequence of equal incidence
host: species name of the organism host to the virus
highestEntropy.position: k-mer position that has the highest entropy value
highestEntropy: highest entropy values observed in the studied protein
averageEntropy: average entropy values across all the k-mer positions
2.2. Parameters
2.2.1. Input Parameters
2.2.1.1. Host Name
Species name of the organism host to the studied virus.
2.2.1.2. Size of k-mer
k-mer, a window with size of k, gives us the overview, overall diversity of that particular window. By default, DiMA uses k-mer size of nine to evaluate the viral diversity, with respect to cellular immune response.
2.2.1.3. Protein Name
Name of the protein.
2.2.1.4. Support Threshold
Support is defined as the number of sequences at a given k-mer position that are free of gaps, unknown or ambiguous nucleotide bases, and amino acid residues. Positions with less than 30 sequences (default) are defined as of low support.
2.2.1.5. Sequence Type
Nucleotide or amino acid sequence.
2.2.2. Display Parameters
2.2.2.1. Host Number Selection
Select the number of host studied (one (default) or two hosts). DiveR supports co-visualization of viral diversity dynamics between two hosts.
2.2.2.2. Font Size
Font size displayed on the plots.
2.2.2.3. Line and Dot Size
Line and dot size displayed on the plots.
2.2.2.4. Protein Names in Order
Determine the order of proteins displayed on plot (Please ensure the protein names provided are the same as the one used in input run!).
3. Standalone DiveR
3.1. Installation
.. note:: These instructions assume you have Python (3.7 <= version < 3.11>), RStudio and R (version 3.3.0+ as requested by RStudio) on your computer.
.. code-block:: bash
git clone https://github.com/pendy05/DiveR.git
pip install dima-cli==4.1.1
3.2. Usage
At R Studio, open either server.R or ui.R in the “DiveR/” folder and click on the Run App button on the top right corner of R Studio. DiveR will run just like the DiveR R Shiny App on web server, the only difference is, DiveR is run locally.
.. note:: If you would like to customize the R plots as shown in DiveR, you may access those corresponding R scripts in “R-individual-scripts/” subfolder.
4. Sample Results
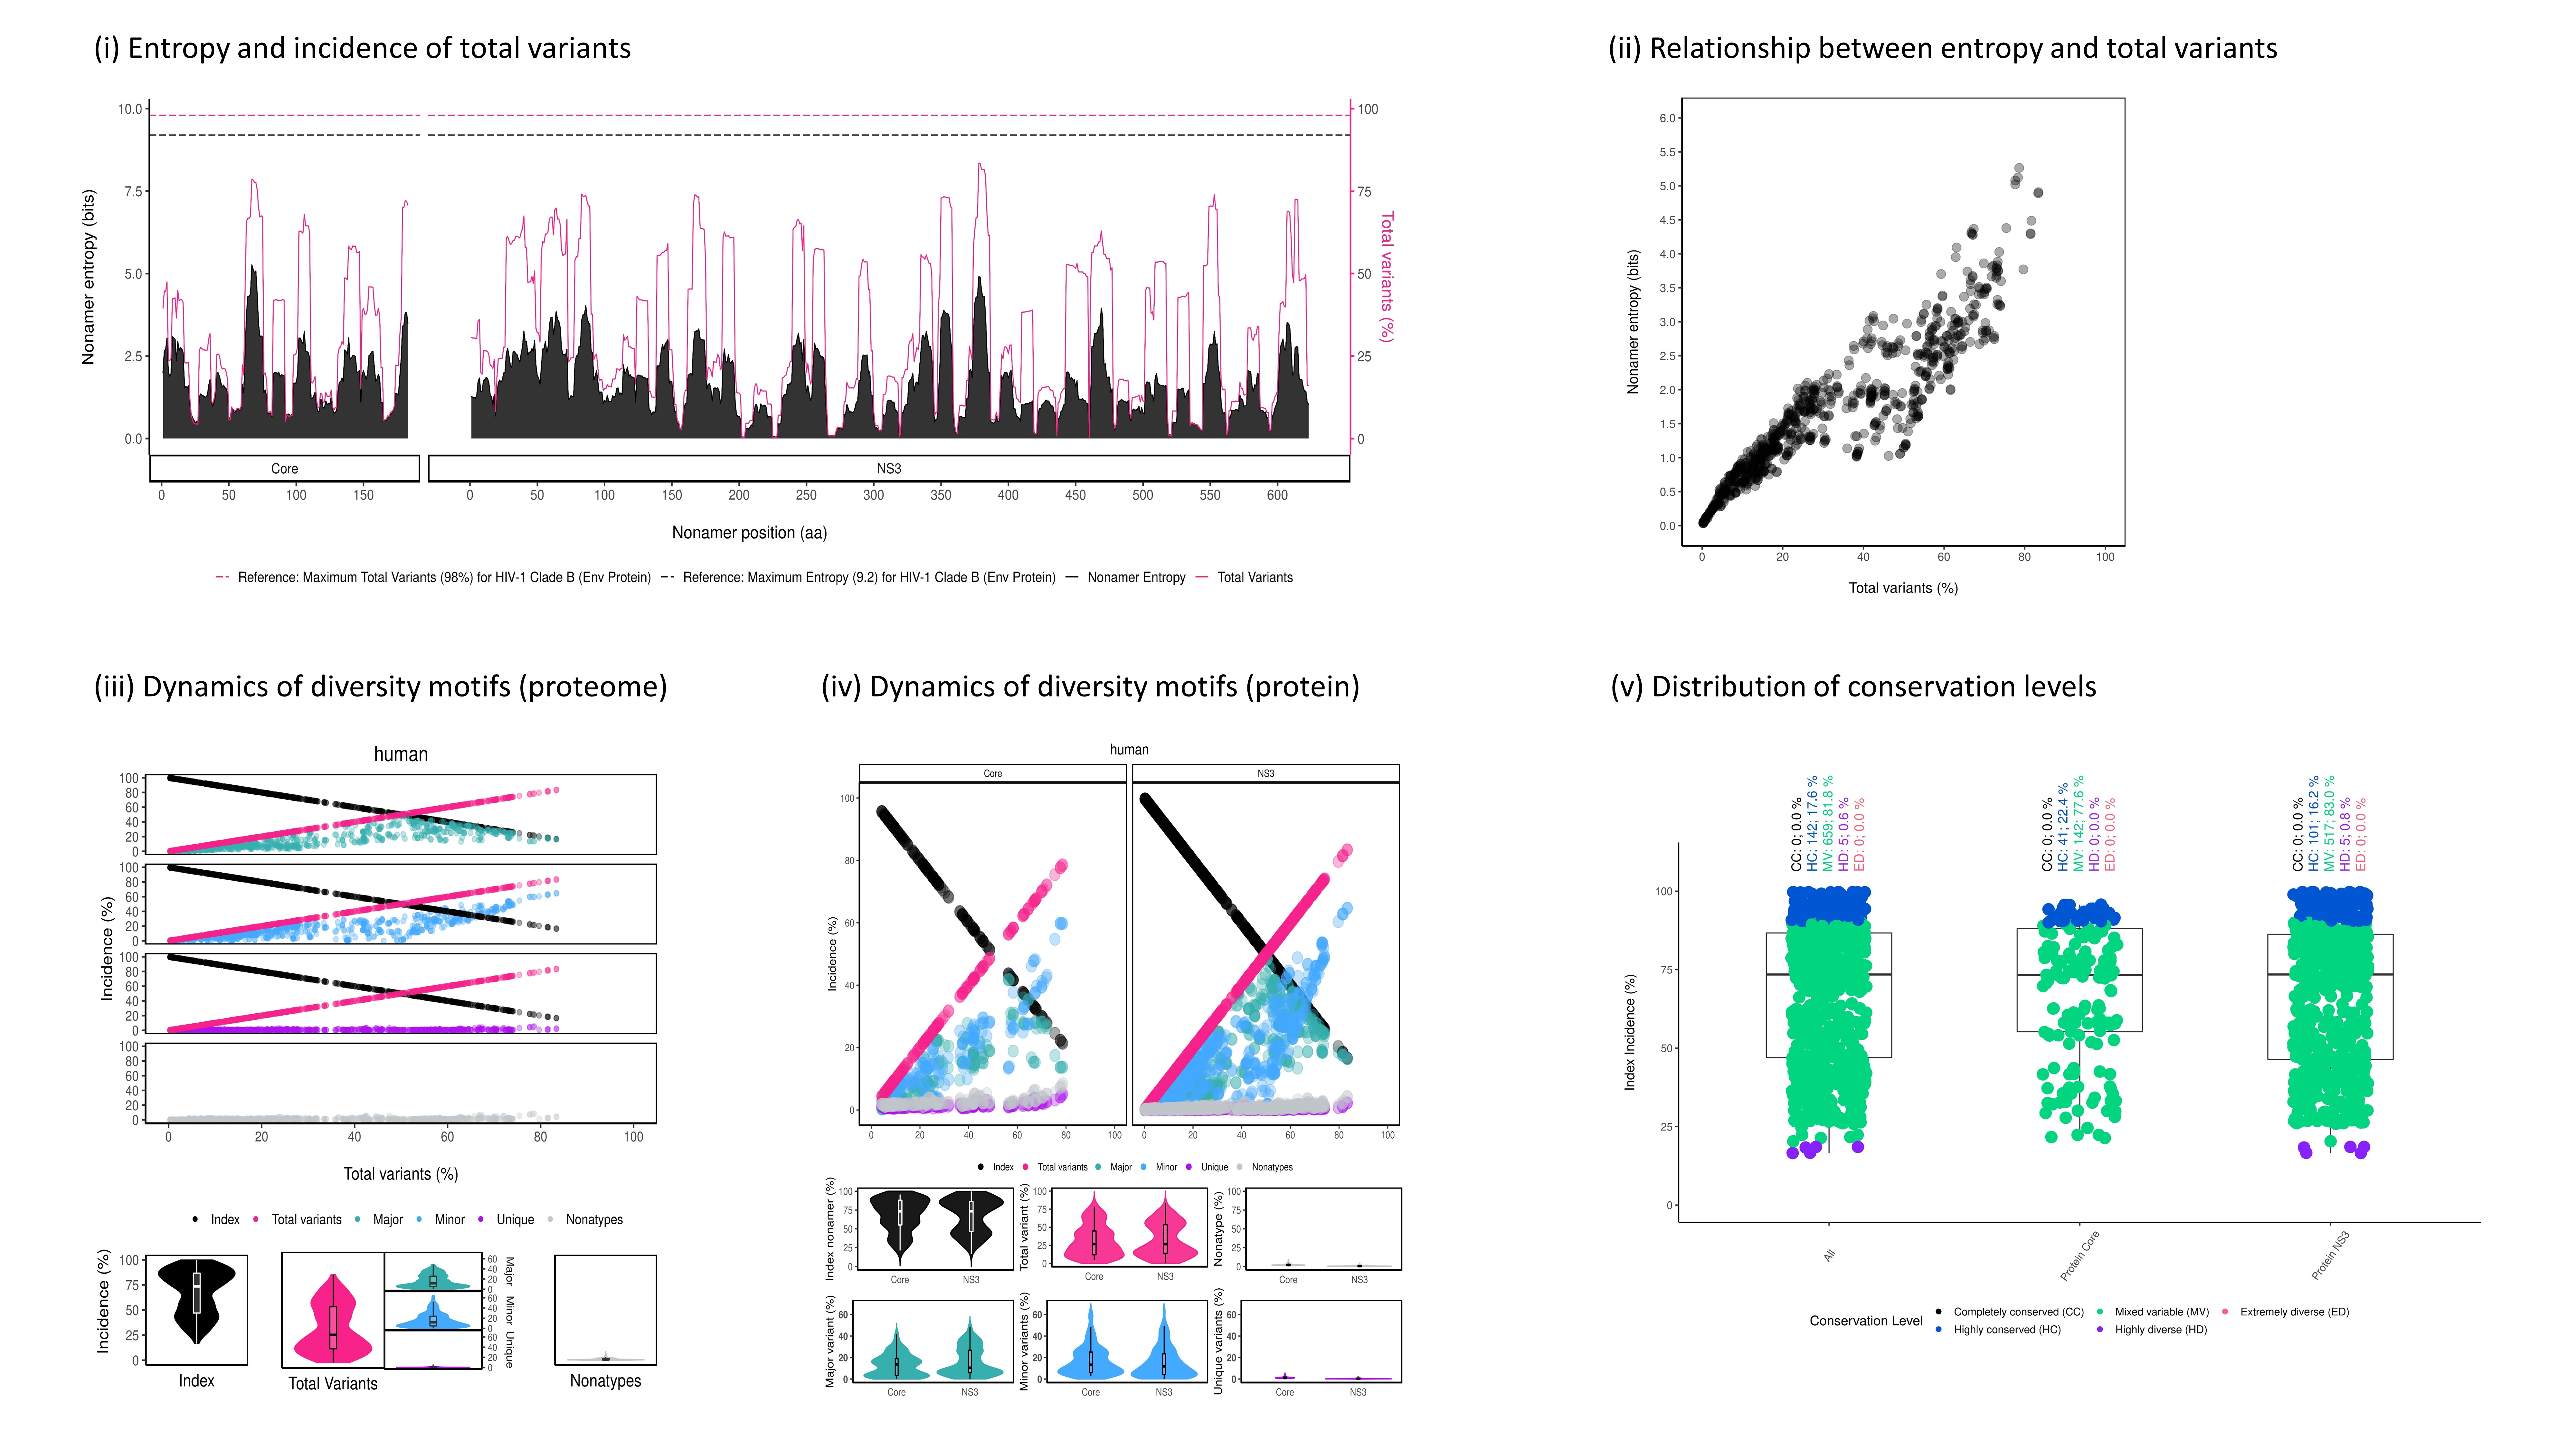
Figure 3. An example of DiveR output, comprising of five plots for sample HCV proteins (Core and NS3)
4.1. Test Data
To demonstrate the functionality of DiveR, the core and NS3 proteins of Hepatitis C virus (HCV) were selected and used as sample datasets. The hu-man host HCV viral protein sequences were retrieved from the publicly available database, National Center for Biotechnology Information (NCBI) Virus (Hatcher et al., 2017). Subsequently, the data was deduplicated using Cluster Database at High Identity with Tolerance (CD-HIT) (Li & Godzik, 2006) and aligned using Multiple Alignment using Fast Fourier Transform (MAFFT) (Katoh et al., 2002). The HCV sample datasets are provided for users to download and run the visualization of sequence change dynamics in DiveR.
.. note:: Sample result is accessible on DiveR R Shiny App via the “Load Sample Dataset” and “Download Sample Dataset” buttons on its side panel.
4.2. Output Summary
In DiveR R Shiny App, after providing either aligned sequence file(s) or DiMA JSON output file(s) in tab 2, visualization of dynamics in sequence change in the form of plots will be presented in tabs 3 to 7, with a brief description of the implemented functionalities (Figure 1).
Tab 3: Entropy and Incidence of Total Variants
Tab 4: Correlation of Entropy and Total Variants
Tab 5: Dynamics of Diversity Motifs (Proteome)
Tab 6: Dynamics of Diversity Motifs (Proteins)
Tab 7: Distribution of COnservation Levels
.. note:: If there is only one protein input, no plot is shown in Tab 5.
4.3. Output (Plots and Tables)
4.3.1. Entropy and Incidence of Total Variants
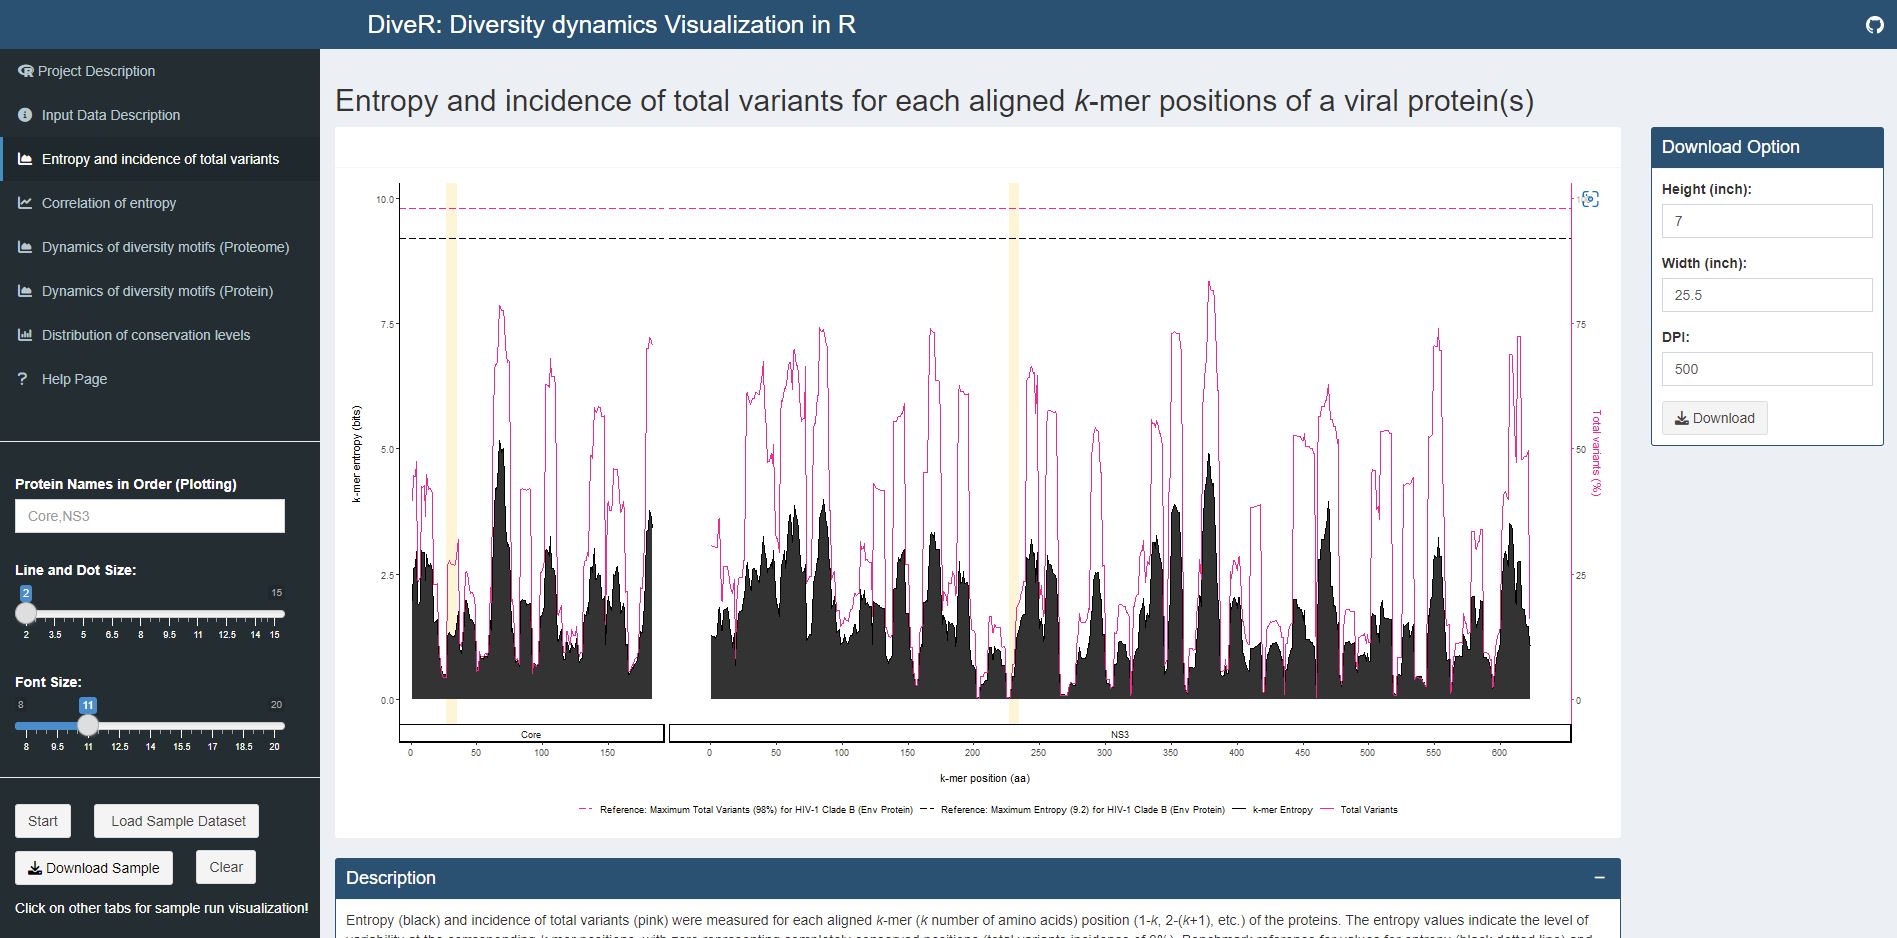
Figure 4.1. Entropy and Incidence of Total Variants Plot for sample HCV proteins (Core and NS3)
 Figure 4.2. Entropy Table for sample HCV proteins (Core and NS3)
Description Entropy (black) and incidence of total variants (pink) were measured for each aligned k-mer position (1-k, 2-k+1, etc.) of the proteins. The entropy values indicate the level of variability at the corresponding k-mer positions, with zero representing completely conserved positions (total variants incidence of 0%). Benchmark reference for values for entropy (black dotted line; 9.2) and total variants (pink dotted line; 98%) that from HIV-1 clade B envelope protein (Hu et al., 2013) are provided. For both individual protein and across proteome, the minimum entropy value is zero. The region highlighted in yellow are k-mer positions with zero entropy value.
4.3.2. Correlation of Entropy
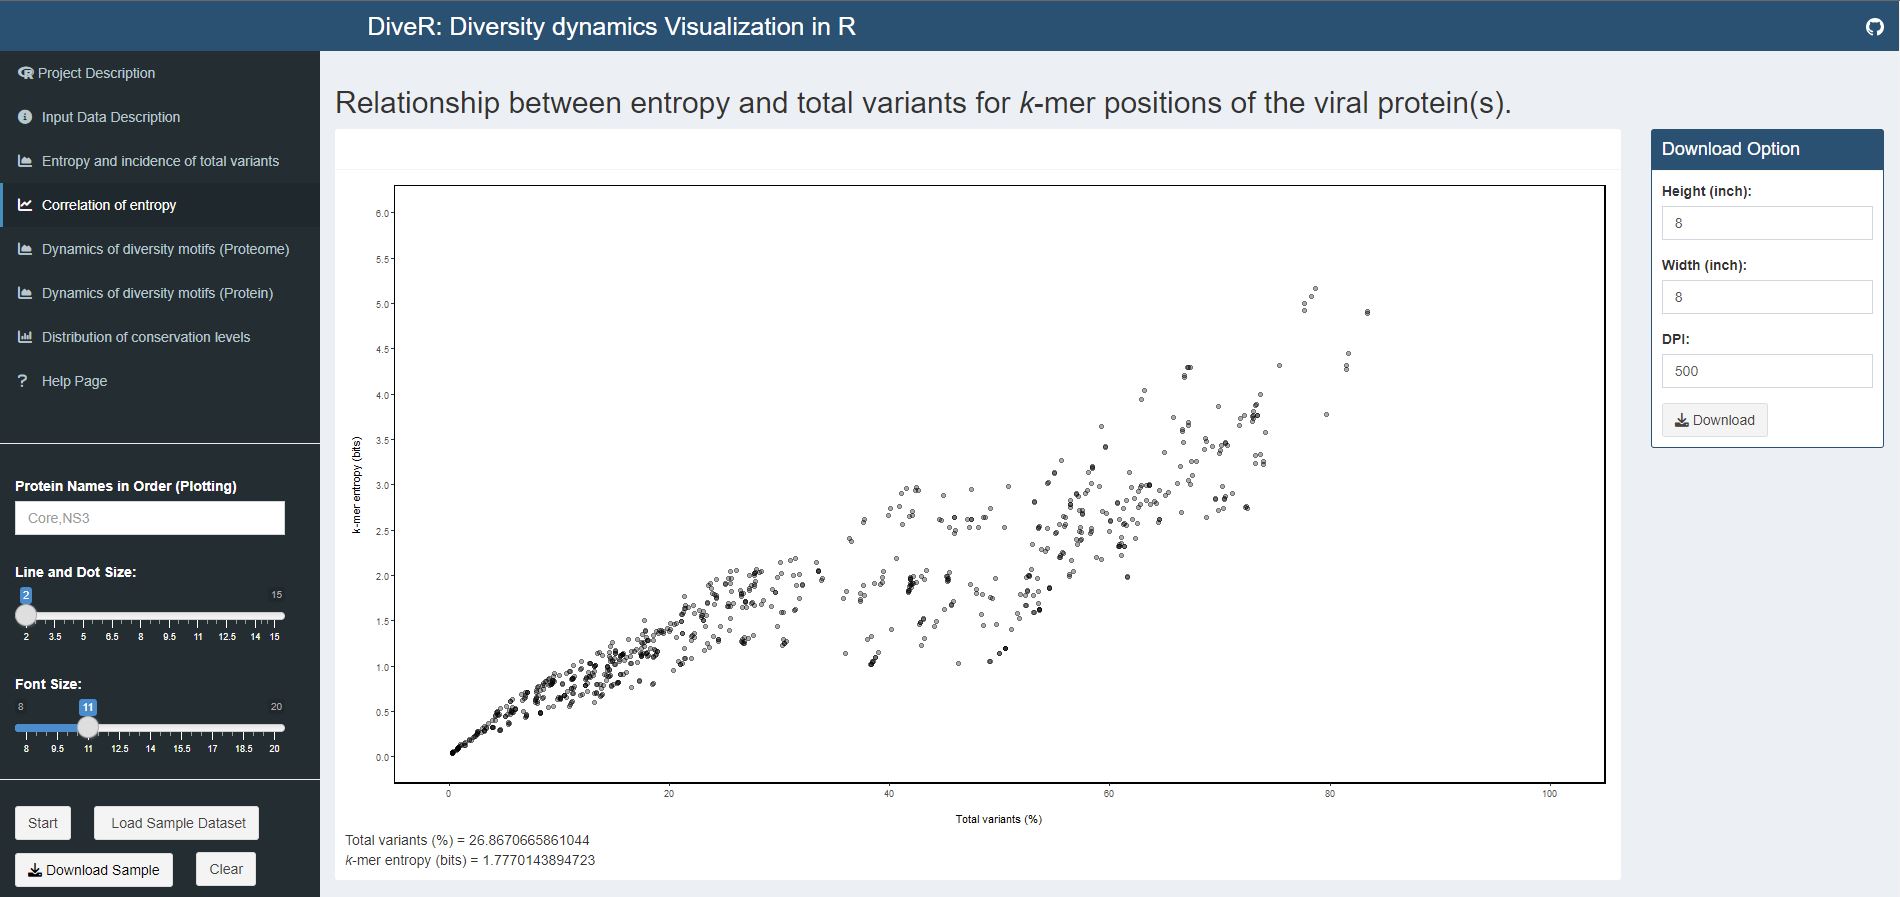
Figure 4.3. Correlation of Entropy and Total Variants Scatter Plot for sample HCV proteins (Core and NS3)
Description Relationship between incidence of total variants and entropy for viral proteome nonamer positions. At y-axis, the minimum entropy value is zero while the maximum entropy value is obtained by rounding the highest entropy encountered up to integer.
4.3.3. Dynamics of Diversity Motifs (Proteome)
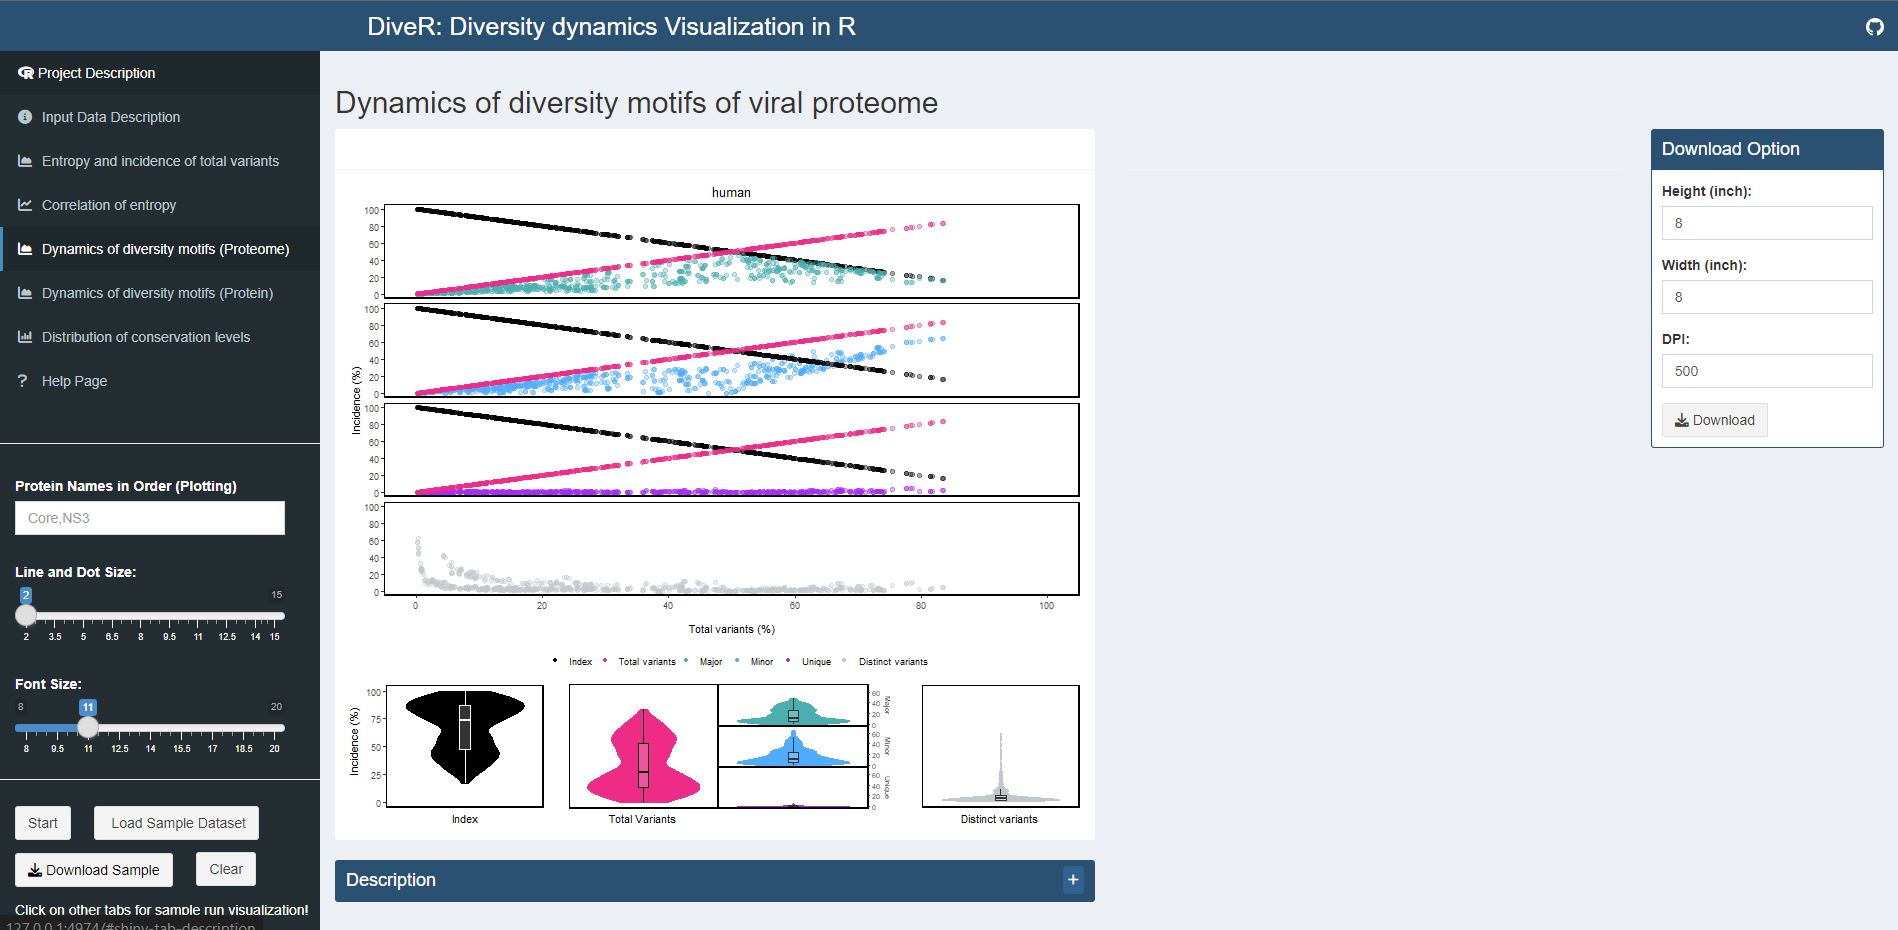
Figure 4.4. Dynamics of Diversity Motifs (Proteome) Plot for sample HCV proteins (Core and NS3)
Description k-mers are classified into four different motifs, namely index, major, minor and unique, based on their incidences. k-merTypes defines as distinct sequence for a given k-mer position. The above dot plot showcases the relationshop between the distribution of four distinct motifs and mutations. The diversity of the position is depicted by the decline of the index incidences (black), the increase of total variant incidences (pink) and corresponding individual patterns of the major, minor, unique and k-merTypes motifs. The below violin plot demonstrates the frequency distribution of the motifs. The width of the plot (x-axis) represents the frequency distribution of a given incidence of the indicated motif. The black thick horizontal line of box plot in the middle represents the median incidence value.
4.3.4. Dynamics of Diversity Motifs (Protein(s))

Figure 4.5. Dynamics of Diversity Motifs (Proteins) Plot for sample HCV proteins (Core and NS3)
Description k-mers are classified into four different motifs, namely index, major, minor and unique, based on their incidences. k-merTypes defines as distinct sequence for a given k-mer position. The above dot plot showcases the relationshop between the distribution of four distinct motifs and mutations. The diversity of the position is depicted by the decline of the index incidences (black), the increase of total variant incidences (pink) and corresponding individual patterns of the major, minor, unique and k-merTypes motifs. The below violin plot demonstrates the frequency distribution of the motifs. The width of the plot (x-axis) represents the frequency distribution of a given incidence of the indicated motif. The black thick horizontal line of box plot in the middle represents the median incidence value.
4.3.5. Distribution of Conservation Levels
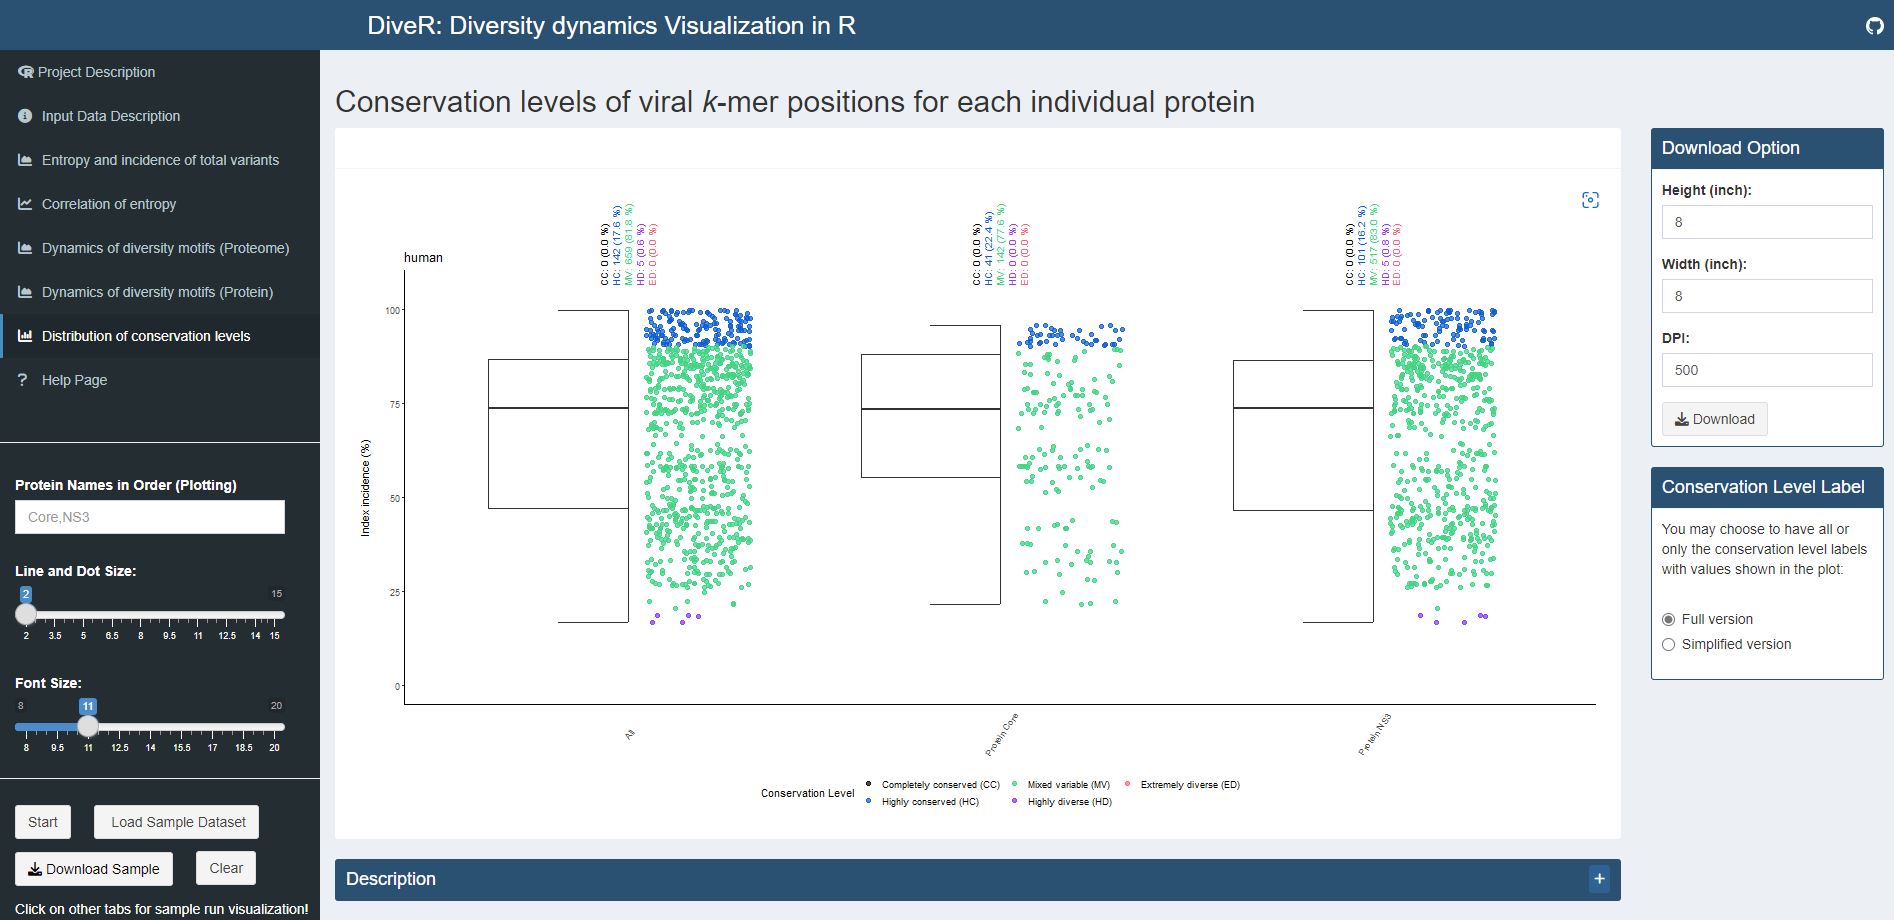
Figure 4.6. Distribution of Conservation Levels Plot for sample HCV proteins (Core and NS3)
Description The k-mer positions of the proteome and the individual proteins were defined as completely conserved (black) ( 𝑖𝑛𝑑𝑒𝑥 𝑖𝑛𝑐𝑖𝑑𝑒𝑛𝑐𝑒 = 100% ), highly conserved (blue) (90% ≤ 𝑖𝑛𝑑𝑒𝑥 𝑖𝑛𝑐𝑖𝑑𝑒𝑛𝑐𝑒 < 100%), mixed variable (green) ( 20% < 𝑖𝑛𝑑𝑒𝑥 𝑖𝑛𝑐𝑖𝑑𝑒𝑛𝑐𝑒 ≤ 90%), highly diverse (purple) (10% < 𝑖𝑛𝑑𝑒𝑥 𝑖𝑛𝑐𝑖𝑑𝑒𝑛𝑐𝑒 ≤ 20%) and extremely diverse (pink) ( 𝑖𝑛𝑑𝑒𝑥 𝑖𝑛𝑐𝑖𝑑𝑒𝑛𝑐𝑒 ≤ 10% ).
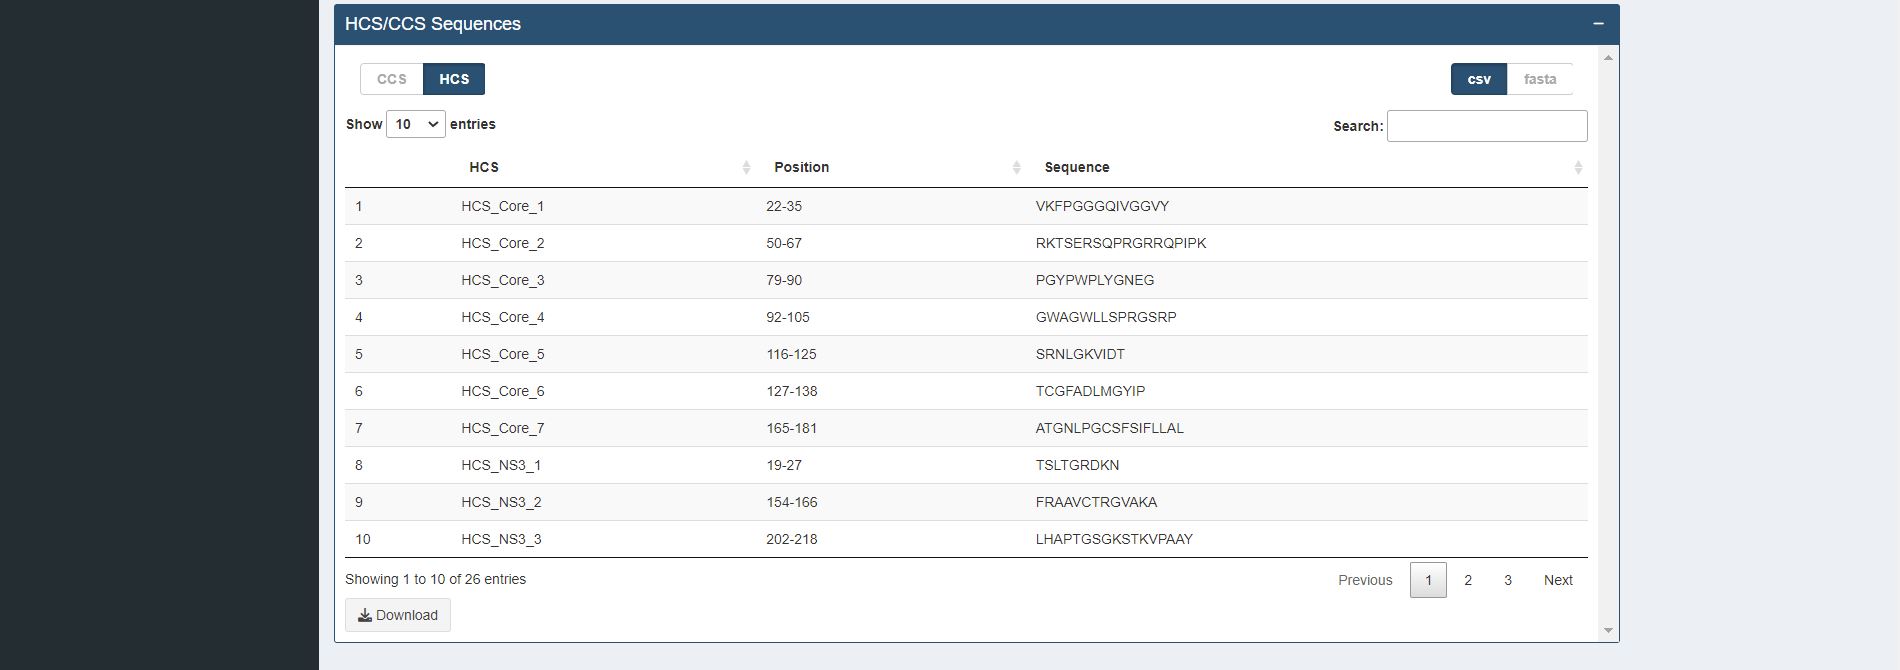
Figure 4.7. Identification of Completely (CCS) / Highly Conserved (HCS) Sequences Table for sample HCV proteins (Core and NS3)
Description The k-mer positions that overlapped at least one k-mer position or are adjacent to each other are concatenated and displayed in table format. The concatenated sequences can be used for further immune relevance analysis via the usage of the Immune Epitope Database and Analysis Resource (IEDB) (Vita et al., 2019).
5. FAQs and Support
5.1. Support
For technical assistance or bug report, please reach us out via GitHub https://github.com/pendy05/DiveR. For the general correspondence, please email Dr. Asif M. Khan (asif@perdanauniversity.edu.my, makhan@bezmialem.edu.tr).
5.2. Team
Pendy Tok
Li Chuin Chong
Evgenia Chikina
Mohammad Asif Khan